Cumulative Layout Shift at Data4Life
In our previous post, we introduced the Core Web Vitals and discussed how we could improve these metrics, starting with addressing the Largest Contentful Paint (LCP).
In this follow-up, we’ll explain what Cumulative Layout Shift (CLS) is, why it’s important, and how we improved our CLS score here at Data4Life.
A real-world example
On the Data4Life website, we implemented an announcement bar (also known as announcement banner or promo bar) to increase traffic to one of our pages. An announcement bar is an attention-grabbing strip that typically sits at the top of a website and displays an important message. On the Data4Life website, visitors can click the announcement bar text to go to a new page with more information, or click the cross icon to hide the announcement bar.
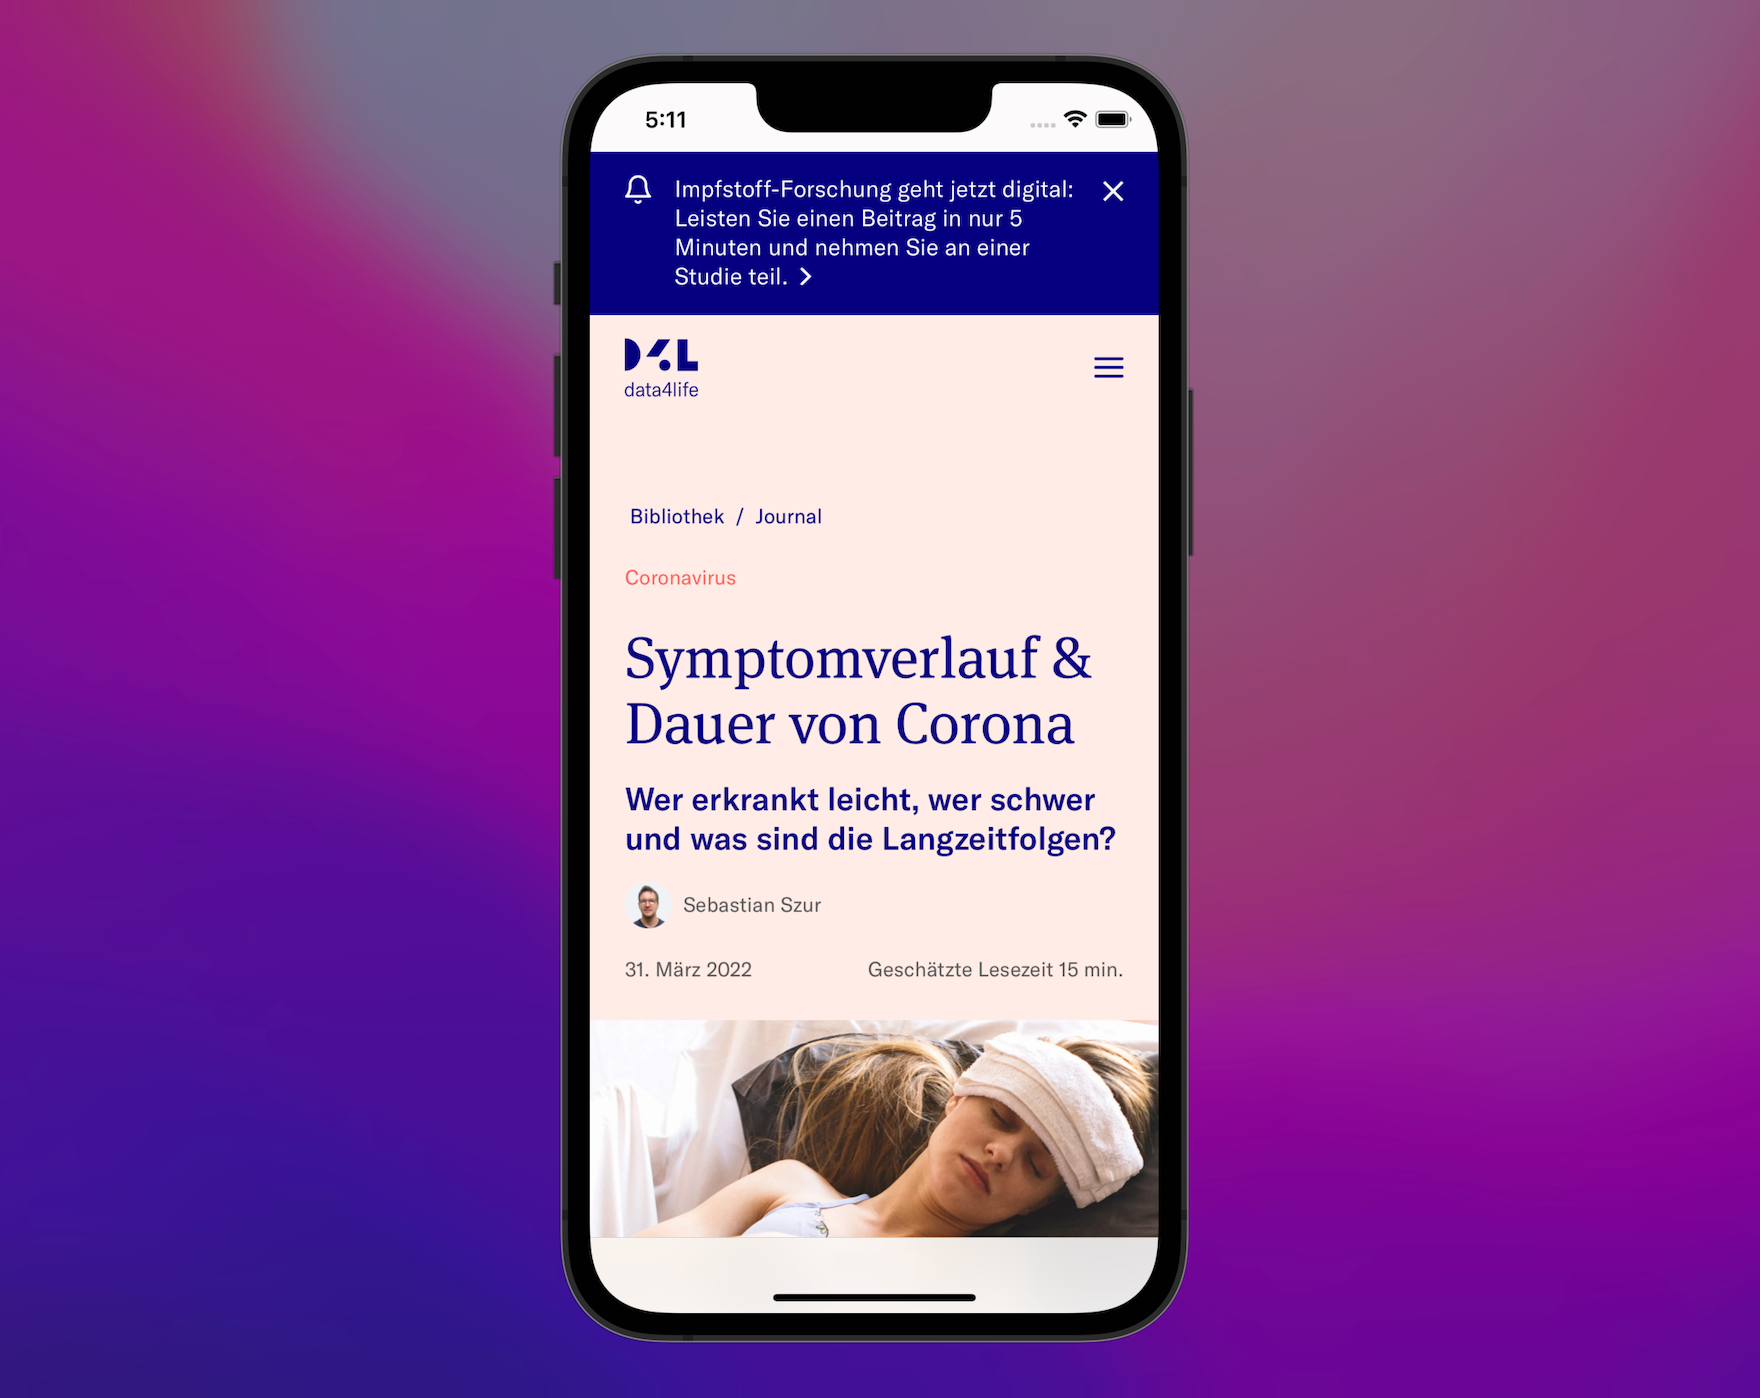
Figure 1: The announcement bar (the blue bar with white text) on the Data4Life website invites visitors to join a health study.
When someone visits the website, their web browser checks its sessionStorage for a value Data4Life sets. This value is only set if the visitor hides the bar. If the browser doesn’t find this value once the page is loaded, a CSS class is added to the announcement bar’s HTML element to display the bar. This check is repeated whenever visitors visit another page on the website.
The promoted page began to gain more traffic and it seemed the announcement bar was doing its job. But to give our visitors the best experience possible, we wanted to check if the bar had negatively impacted the website’s performance and usability.
We conducted an audit against the Core Web Vitals by running 1 of our pages through WebPageTest while simulating a throttled 4G mobile connection. Here’s how that page performed:
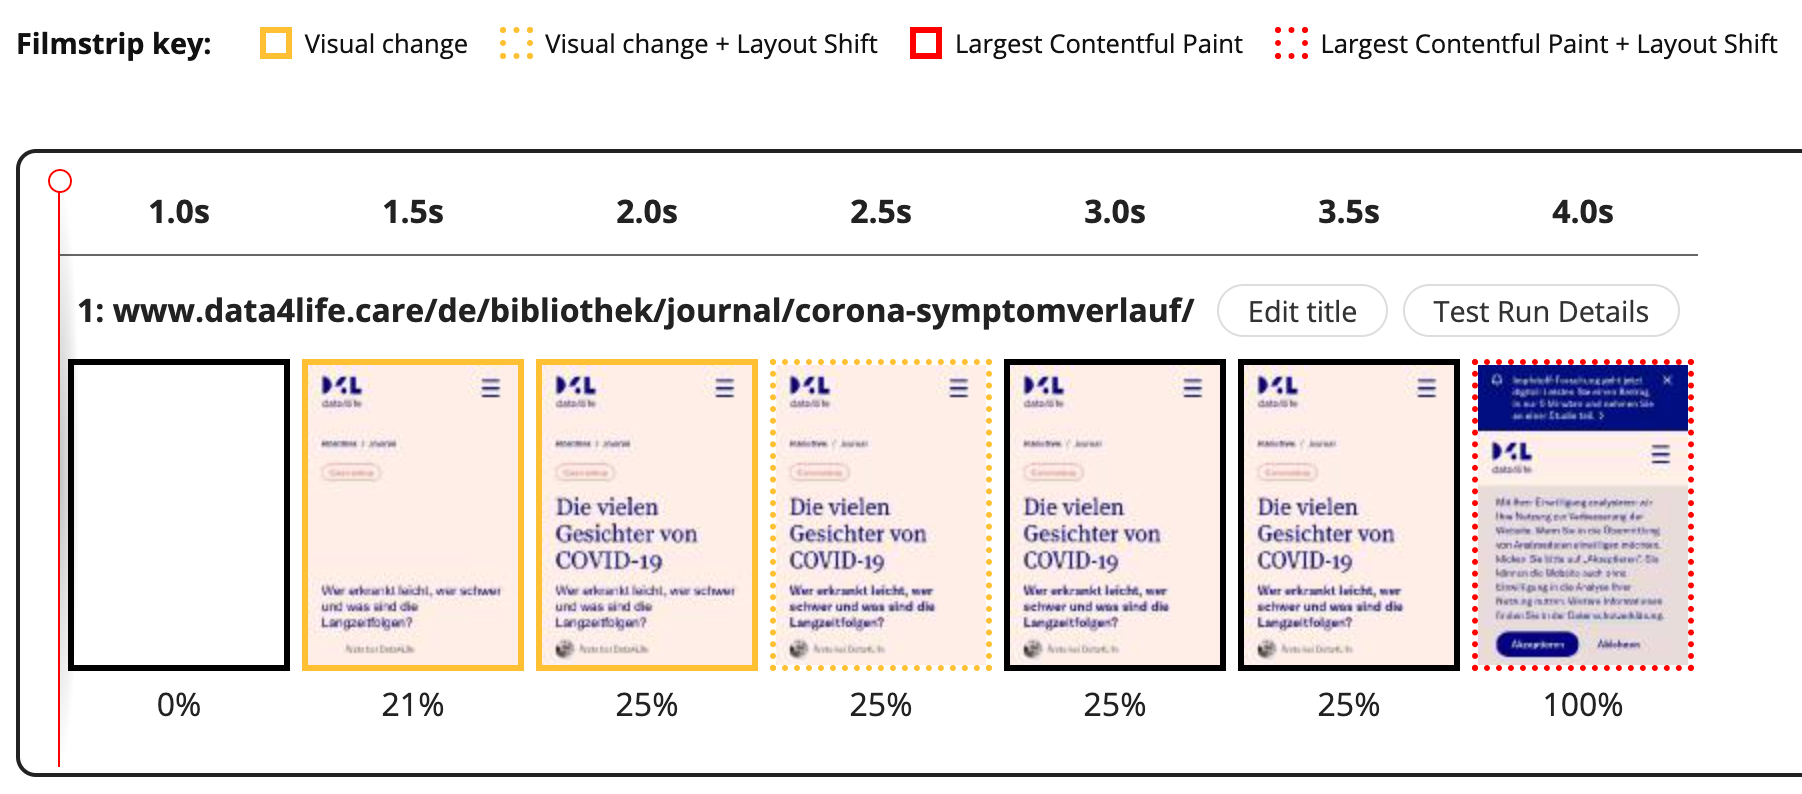
Figure 2: Timeline of our test page showing each half second of load progress. It took four seconds to completely load the page.
On the filmstrip, we see most of the elements above the fold are already painted within the first 2 seconds, including the header navigation, page title, and author thumbnail. It’s only at the end of the page load that the announcement bar is displayed, 2 seconds after our visitors see the first visual elements. The announcement bar has also pushed the header navigation down by at least 4 lines of text. (Note in the final frame we see the inclusion of our cookie banner. As it occupies over half of the viewport, it’s detected as the Largest Contentful Paint. This doesn’t affect our Layout Shift score, so we can ignore the cookie banner for the scope of this article.)
The CLS score in our test was 0.219, placing it in the yellow needs improvement category. To provide good user experience, Google recommends pages maintain a CLS score of 0.1 or less.
So we had something that we could improve, but to do so we first needed to understand what CLS is and what the score meant.
What is CLS?
CLS can be a difficult topic to grasp, but Jess Peck sums it up well in the article The almost-complete guide to Cumulative Layout Shift:
CLS is a measure for a robot to approximate the user perception of instability.
In other words, CLS calculates how much unexpected movement there is on a page and how often it occurs. The more movement there is, the more annoying the experience is for visitors.
Let’s look again at our filmstrip. Visitors can begin reading after 2 seconds when the page title is displayed . But 2 seconds later the announcement bar is displayed, pushing the previously loaded content down and forcing the reader to readjust their focus. This can be irritating, and CLS is a way to quantify this emotion.
How is CLS calculated?
To understand how the CLS score is calculated, I recommend watching Annie Sullivan’s Understanding Cumulative Layout Shift. I’ll summarize the key points here.
First, we identify all the elements that were shifted from one animation frame to the next. In our example, the announcement bar was jammed in at the top of the page, so everything below becomes shifted elements.
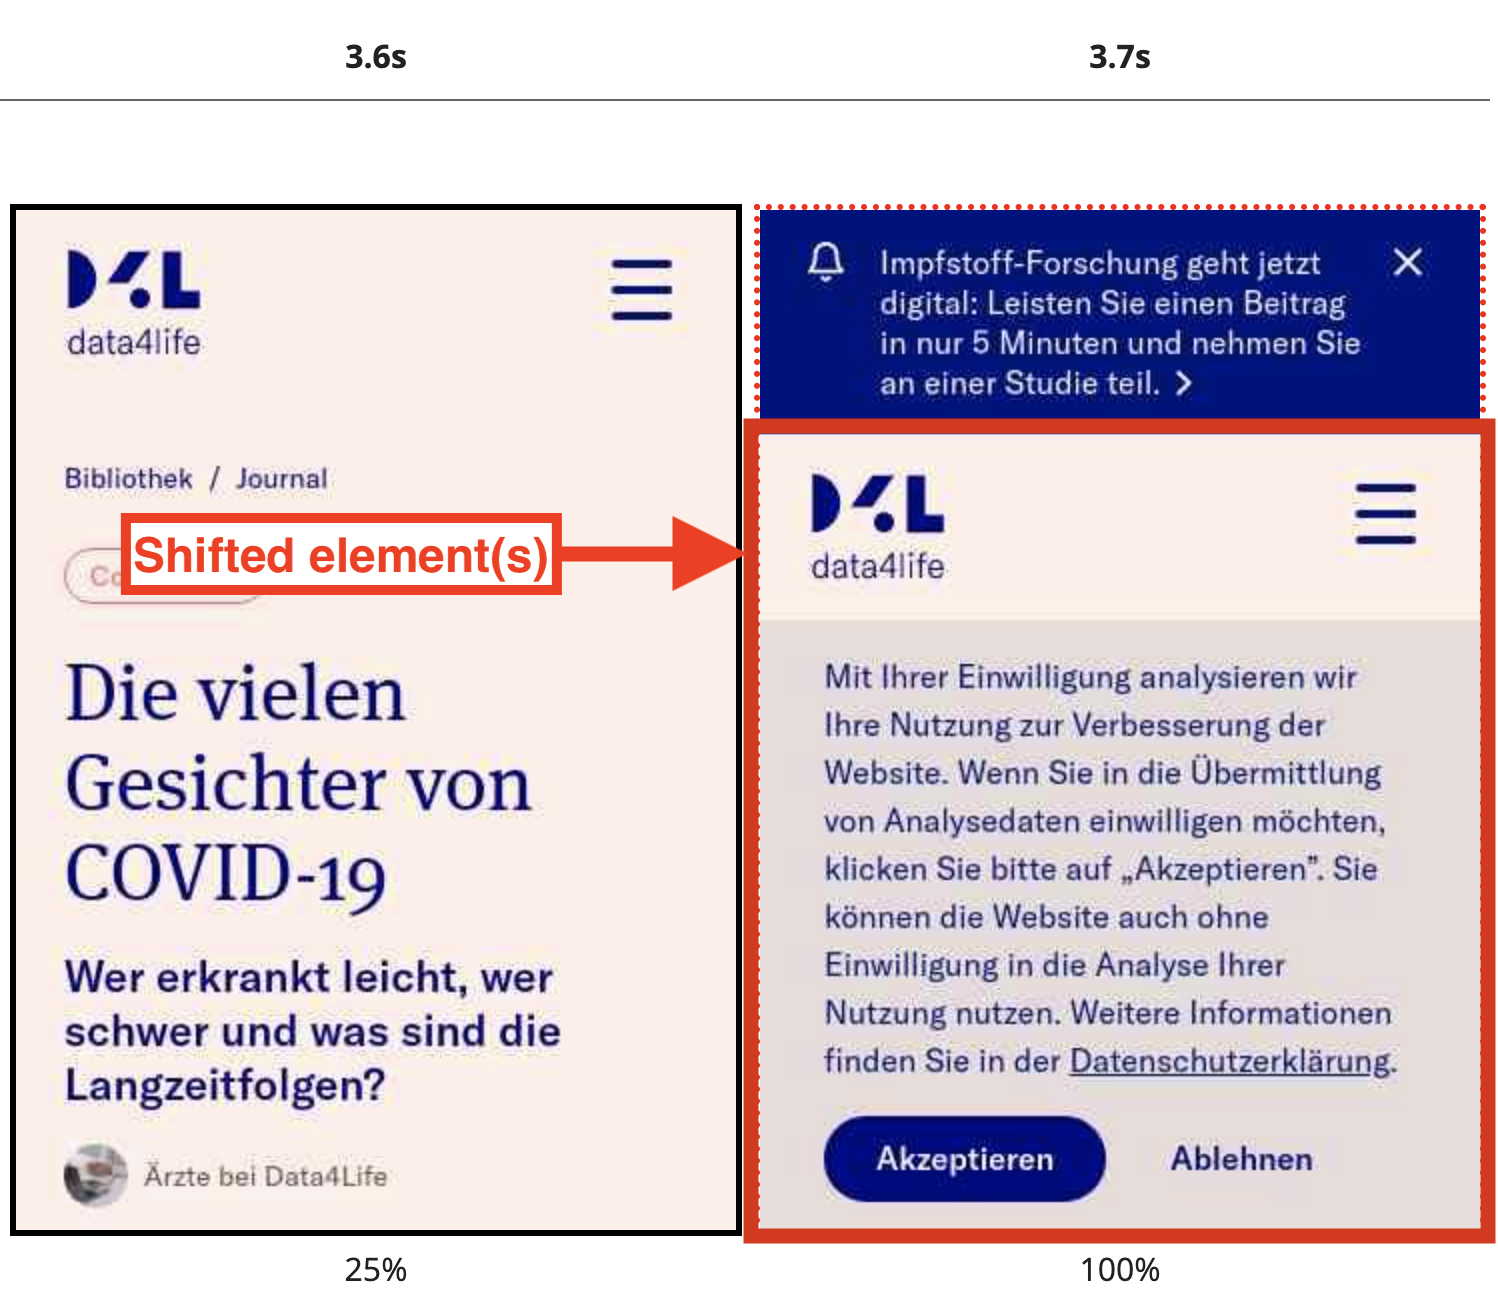
Figure 3: Before (left) and after (right) the announcement bar is displayed at the top of the page. The frame on the right shows elements from the left frame shifted downwards. These are the shifted elements.
Second, we combine the area that these elements occupy before and after the shift. For example, if a block of text was moved, the area of the text block is combined with the area it previously occupied:
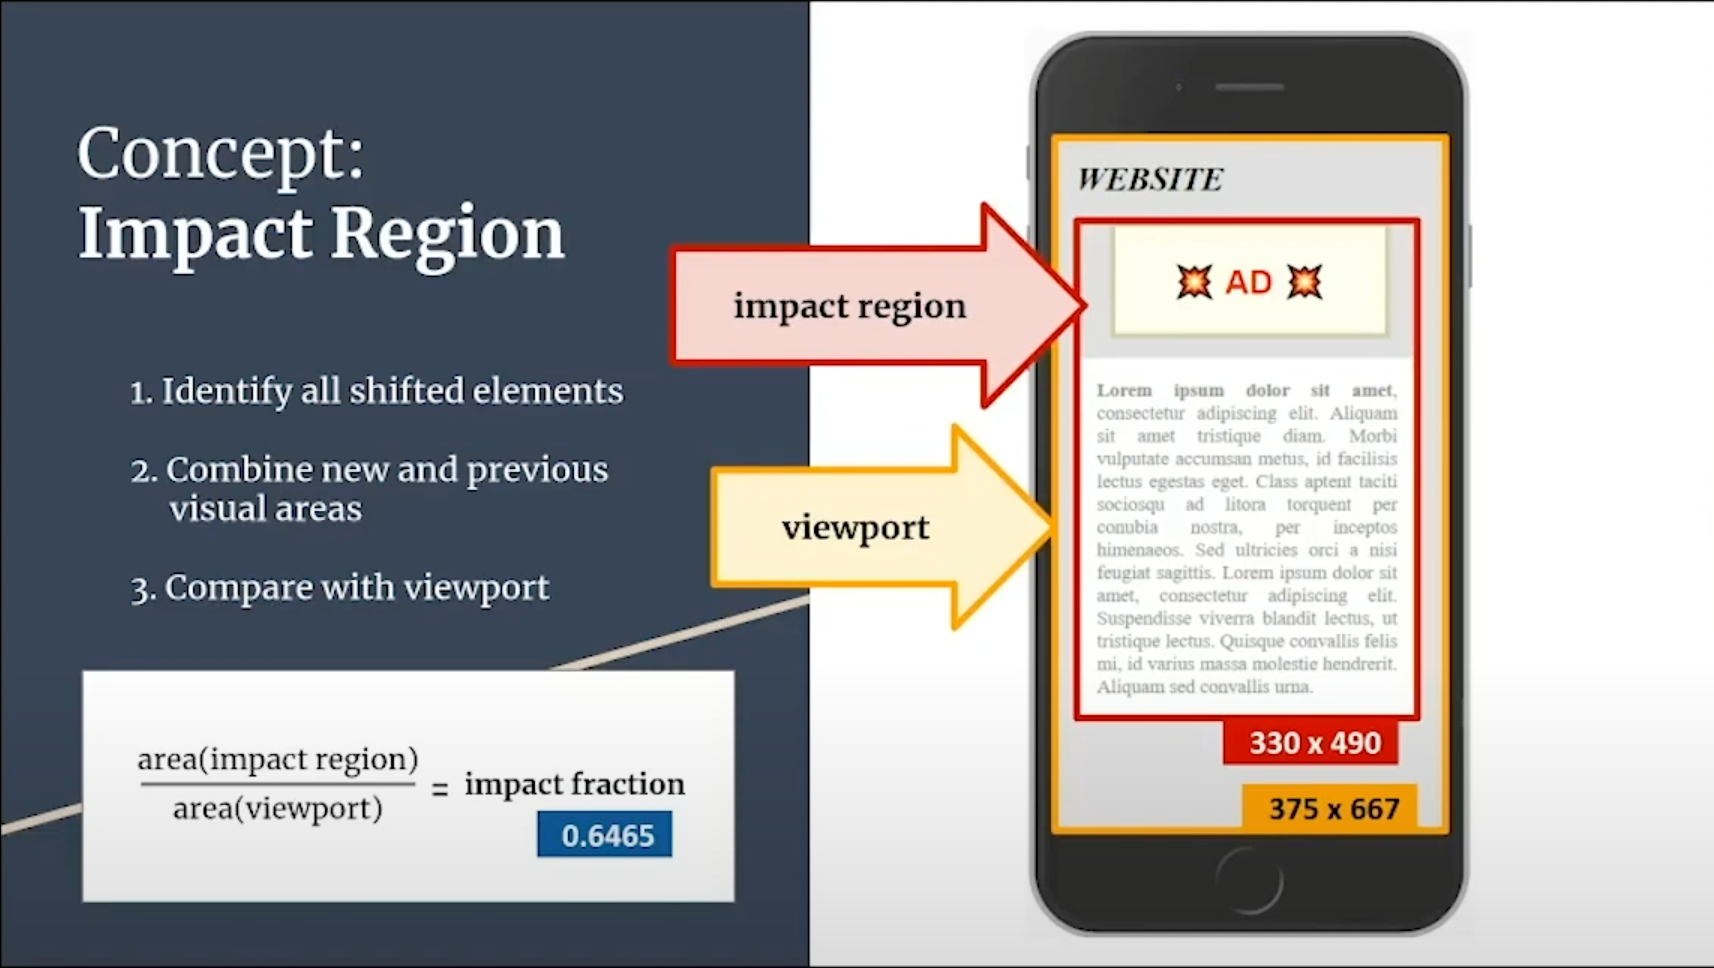
Figure 4: Visualization of the impact region and viewport, with the equation to calculate the impact fraction. Source: YouTube.
In the screenshot above we can see the impact region includes the ad because that’s where the white text block was before the ad appeared. Once the text block is moved, the combined area of the 2 regions becomes the impact region. This impact region is divided by the viewport to give us a ratio of the region affected. This ratio is known as the impact fraction.
Next, we calculate how much the shifted elements have moved. To do this, we take the move distance and divide it by the viewport height to get the distance fraction.
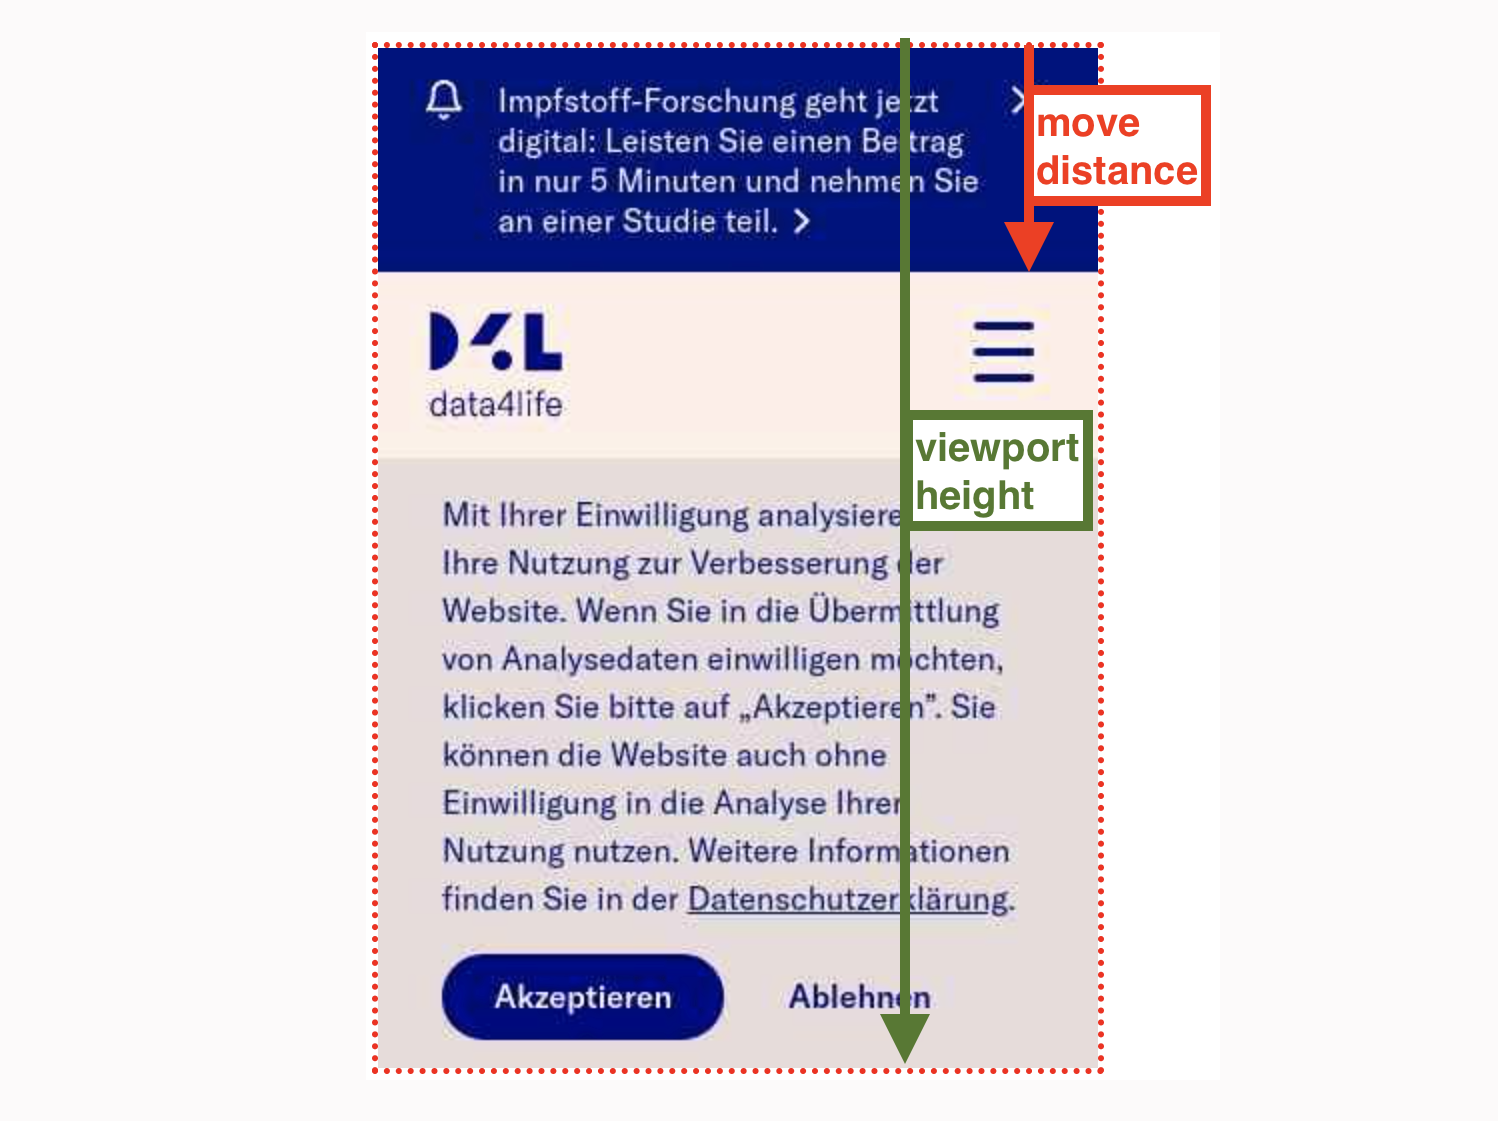
Figure 5: The move distance and viewport height caused by our announcement bar.
We can multiply the 2 fractions, impact and distance, to get the Layout Shift score for a single animation frame in the browsing session.
When all the Layout Shift scores are added together, from the start of the page load until the visitor leaves the page, we finally arrive at the Cumulative Layout Shift score.
Let’s try to calculate the Layout Shift score for the Data4Life website. Since everything was forced down by the announcement bar, our impact region is the entire viewport. We divide the impact region by the viewport to get an impact fraction of 1. Looking at the screenshot, we can estimate the announcement bar will take up around 20% of the viewport height. This gives us the distance fraction of 0.2. Multiply 0.2 by 1 and we get a Layout Shift score of 0.2.
So the inclusion of the announcement bar alone has given us a poor Layout Shift score (remember Google says pages should aim for 0.1 or less), and we haven’t even reached the cumulative part!
The content of the announcement bar in our current example is 4 lines of text in mobile view, however this could change depending on what we want to say, and in which language we want to say it. This variable makes it difficult to keep our distance fraction consistent, so it would be best to turn our focus to minimizing the impact region instead.
In other words, since we cannot control how much elements will shift, let's try to minimize what gets shifted, and when.
When did the layout shift?
To determine exactly when the layout shift occurred, let's analyze what goes on during the initial page load. Here's a snapshot of our WebPageTest Waterfall Chart:
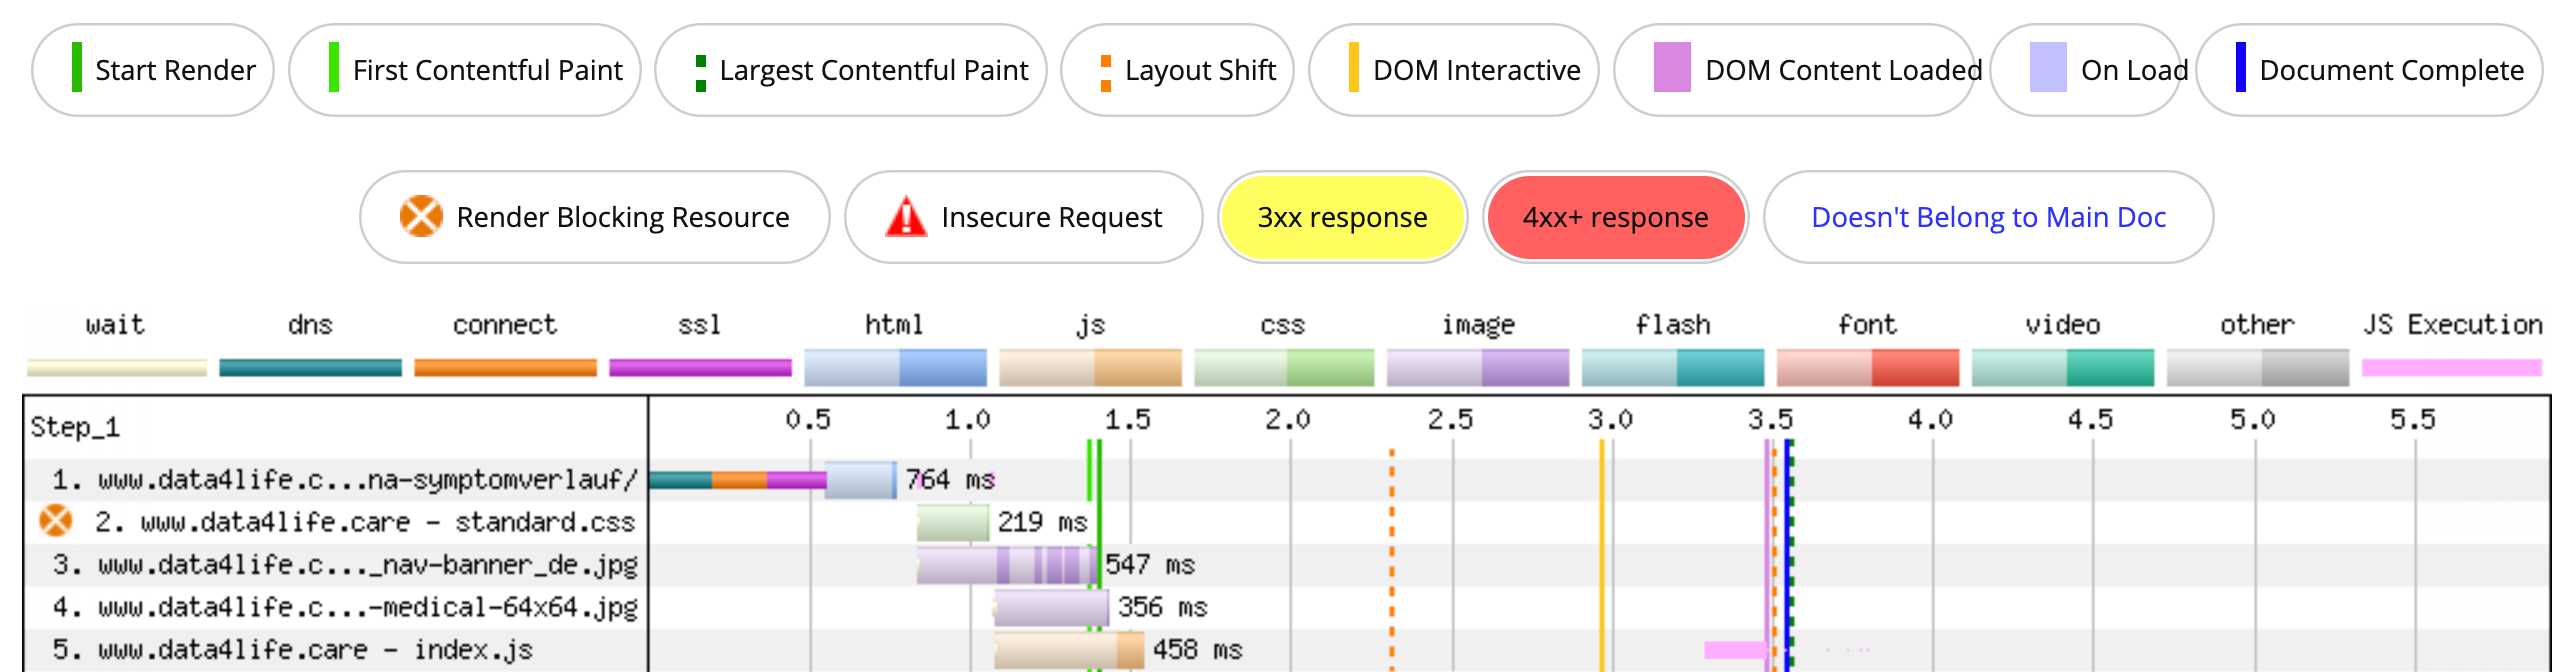
Figure 6: Waterfall Chart of our test audit.
A Waterfall Chart lists the page's resources and their lifecycle, from being discovered by the browser to being fully downloaded. The lifecycle is represented by colored bars with a light and dark shade. The light shade indicates the time that the browser sends the request until it receives the first byte. The dark shade indicates the period where the resource is downloading.
The first 2 resources, the HTML document and CSS file, were downloaded sequentially. Their code is parsed, built into object models, combined to calculate styles and layout, then rendered onto the page. We know this happens after around 1.4 seconds, as indicated by the vertical, dark-green line. This is when visitors start to see something on their screens. (Note this is a simplification of how a browser renders a web page. Inside look at modern web browser is a great series detailing every step of how browsers turn code into a functional website.)
Since JavaScript is used to check whether the announcement bar is displayed, let’s turn our attention to the fifth resource: index.js. Here, we see that the browser discovers the file (represented by the orange bar) at around 1.1 seconds. Its download was completed around 1.5 seconds, shortly after rendering began. But the execution, indicated by the pink bar on the same row, happens almost 2 seconds later. This explains the delay in inserting the announcement bar, but what causes this delay?
How we improved our CLS score
How long browsers take to parse and compile JavaScript code depends on the device the page is loaded on. The higher the device's processing power, the quicker the compilation, and the sooner the execution. Our test was conducted on an emulated Moto G4, which is a budget smartphone released in 2016.
Ideally, we want the light-pink bar (JS execution) and the dark-green line to be as close as possible on the timeline, but we cannot rely on our visitors having the most powerful hardware. We can, however, control where the snippet of code handling the announcement bar be executed, by separating it from the JavaScript file and calling it immediately after the HTML:
<div id="announcementBar">
   <h3>Impfstoff-Forschung geht jetzt digital: ...</h3>
   <button aria-label="Close">X</button>
</div>
<script>
   if(!sessionStorage.getItem('closedBanner')) {
document.getElementById('announcementBar').classList.add('announcementBar--show');
   }
</script>
By inlining the script, the announcement bar code snippet is included with the HTML document. It’s then parsed, compiled, and executed during the rendering phase, which we know has a head start over the JavaScript file’s lifecycle. By the time that the browser finishes compiling the JavaScript file, all the work surrounding the announcement bar has already been carried out.
After we edited the code, we ran the test on WebPageTest again:
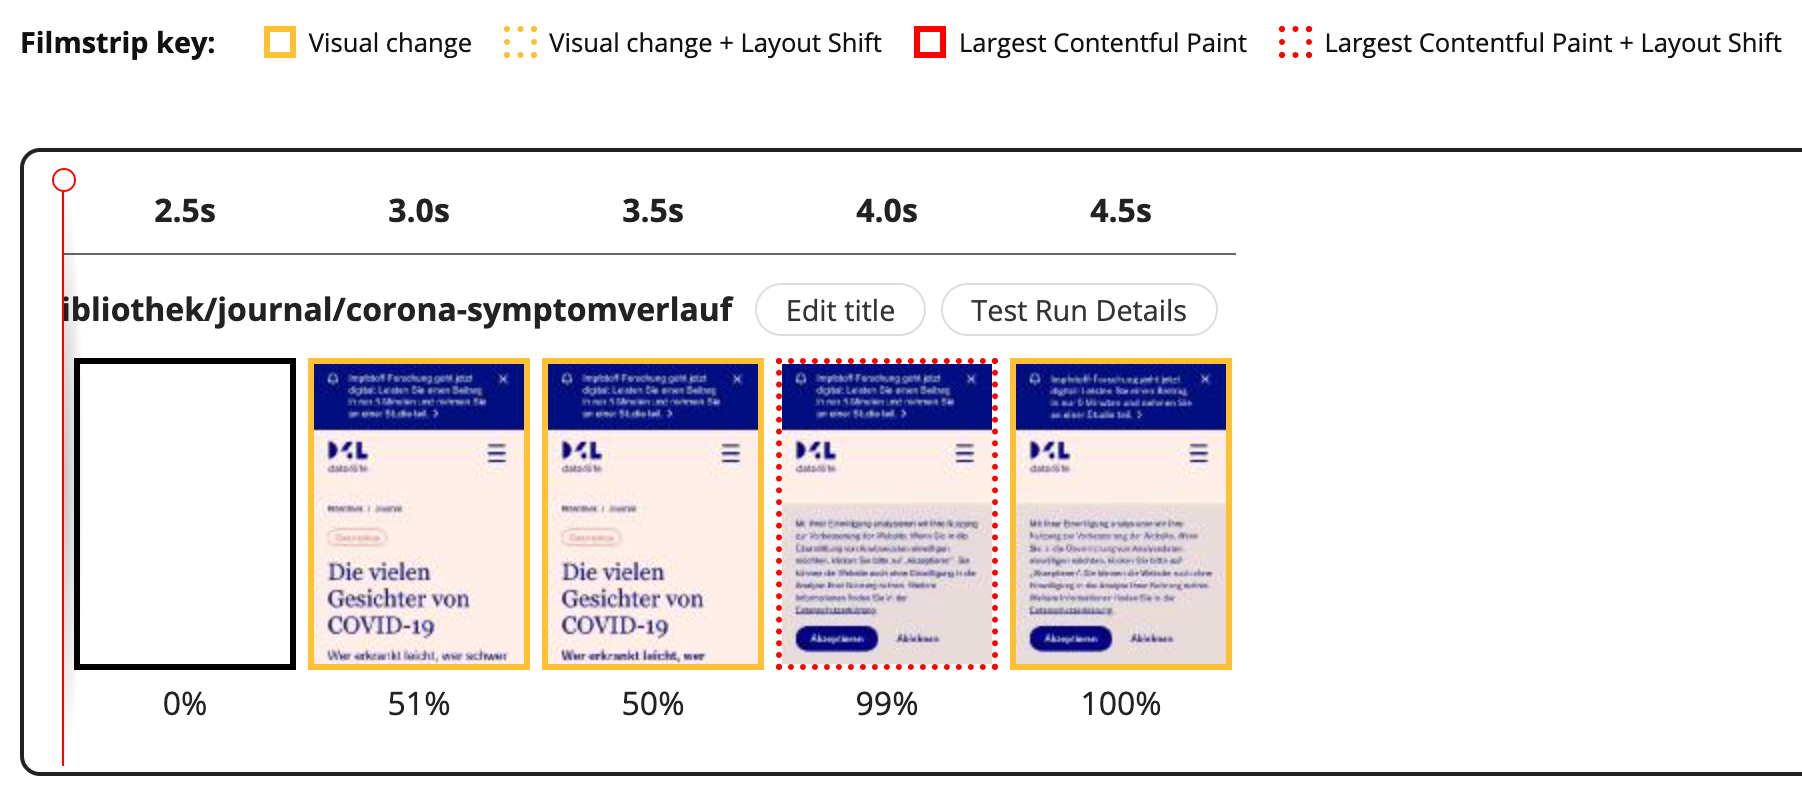
Figure 7: Timeline of our test page with the new code.
The most important thing to note here is the visual progression in the first 2 frames. The page changes from displaying nothing, to displaying the announcement bar with the other elements. Since the announcement bar code was bundled with the HTML document, the browser has rendered it earlier in its lifecycle. Therefore no further elements need to be shifted and all regions that would have been impacted by layout shift have been removed.
The impact was clear: the CLS score in this test was 0.003, a massive improvement of 98.6%!
But there’s a caveat: While our CLS score decreased from 0.219 to 0.003, our First Contentful Paint (FCP) score increased from 1.368 seconds to 2.72 seconds. FCP measures how long it takes from when the visitor hits your page, until their browser displays something on screen. The increased delay occurs because JavaScript blocks HTML parsing. So while our CLS score solution is simple, it should be used with caution, as it comes at the cost of FCP. In this case though, making users wait an extra 1.3 seconds (if their device has the same processing power as WebPageTest’s test device) to avoid annoying shifting elements seems like a worthy trade.
What else causes CLS?
We’ve touched on some of the reasons why CLS occurs but there are others. Barry Pollard’s article How to fix Cumulative Layout Shift Issues lists more possible causes of CLS and suggests ways to fix them. For example, custom web fonts can also cause layout shifts as it takes time to download font files before applying them to a page. This is something we could investigate to bring our CLS score closer to 0.
A better user experience
That's it, we've achieved our goal of drastically reducing our CLS score and improving 1 of the Core Web Vitals metrics. This may also help our page ranking, at least for Google. But most importantly, we made a measurable improvement to the page experience for our website's visitors.
I hope I’ve given you some useful insights into what CLS is, how it works, and how it’s calculated. And together with our announcement bar use-case and field data, perhaps it could inspire a solution for your own web products.